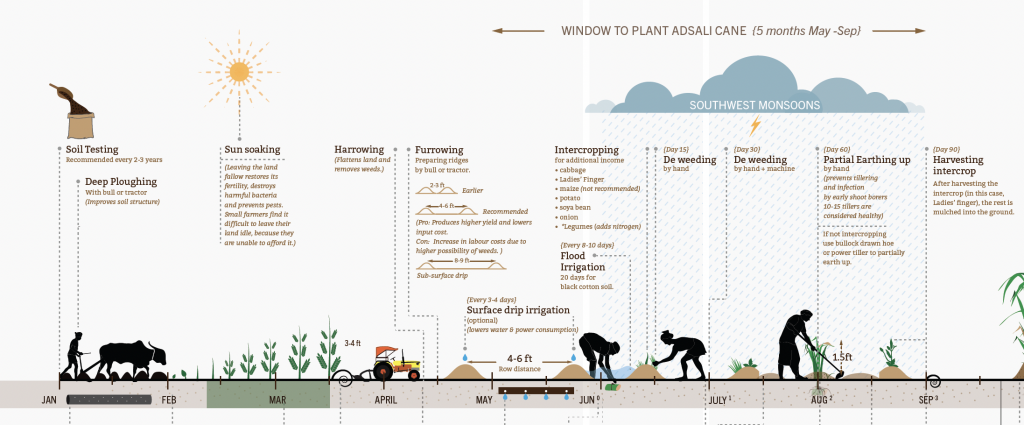
A few years ago, while working with a sugarcane manufacturer, the BRND Studio team created a large-scale, five feet by three feet illustrated map of the 4.5 year life cycle of the Adsali cane crop. The map was stratified so that we could plot multiple processes and systems alongside each other, over this long period of time. The result was a comprehensive overview of the entire process of sugarcane farming, beginning from seed all the way to sale.
Our brief was to design a digital intervention to promote sustainability among farmers. However, we felt it was essential to first understand the farmer, his crop, his customer (our client), and how the three were connected. In order to come up with the right ‘hook’ that could make our product invaluable to farmers, we needed to understand all the moving parts of this world.

Though we are not agronomists, we do have methods to make sense of such interconnected processes, in order to design robust solutions that solve real customer needs. The farmer is one of many people in this journey, and while each person may know their exact role, what we often found was they did not have a clear picture of how that fit into (and impacted) the larger scenario. As we ‘dug’ deeper into farming through research and interviews, we realized we needed an artifact to communicate its inherent complexity in a way that was memorable and digestible.
The designers reading this will probably recognise that what we had created was a journey map, a visualization tool typically used to develop holistic, end-to-end customer experiences. It borrows ideas from systems thinking, as it plots out subsystems that interact with each other to create a different (often greater) output. It may not resemble the way systems are conventionally depicted – with in-flows, stock, out-flows and feedback loops – but it helps create a deeper level of understanding of how various elements influence each other. While a system map objectively depicts nodes and connecting points, the subsystems in a journey map are viewed in relation to the user or customer. It highlights the needs, beliefs and challenges faced by them, which drive us to create a smoother, easier or more effective experience.
Cultivating and selling sugarcane is not an easy process, but neither can one call it ‘complicated’. Since it relies on natural and human forces, there are many layers and ‘systems within systems’ involved, for instance:
- The crop and weather systems, give us a technical understanding of the crop management techniques, crop behaviour, weather patterns and interaction between the farmer and the factory.
- The soil system. Starting with the soil test, which informs farmers about the health and viability of their soil. With precise knowledge of their soil status, they can choose the right practices and quantity of nutrient in-flows required to gain the maximum yield at the end of the season.
- The financial system includes the purchase of seeds, loans taken and sale of crops at the end of the season.
There is no way to simplify the process beyond a point, and these layers serve a clear objective – higher crop yield that leads to increased income for the farmer.
Every product we build is similarly a ‘system of systems’. Our role as designers is to set up the conditions for these systems to perform to their full potential in order to create the best possible experience for the customer. Systems thinking offers us a 10,000 feet view of the challenge at hand, and lends confidence to our decision making. Furthermore, when building products in such environments, we also need to consider the unintended consequences of the smallest shift in systems. Just as a small change in soil inputs, or unseasonal rain can have a ripple effect; errors, glitches, or what we see quite often – poor emphasis and hierarchy in UI – all negatively impact usability. There’s an idiom about ‘missing the forest for the trees’ that comes to mind. When building technology, we can solve for this by keeping both the forest and the trees in sight.
By Sudhir Bhatia


